Force Velocity Profiling
Unlock athlete’s full potential with force-velocity profiling— Optimize force, velocity, and power for elite peak performance.
FVP – Force Velocity Breakdown with Bram Swinnen

Auto-Generated FVP Graphs to Act On
FVP Graphs for Easy Player Comparison
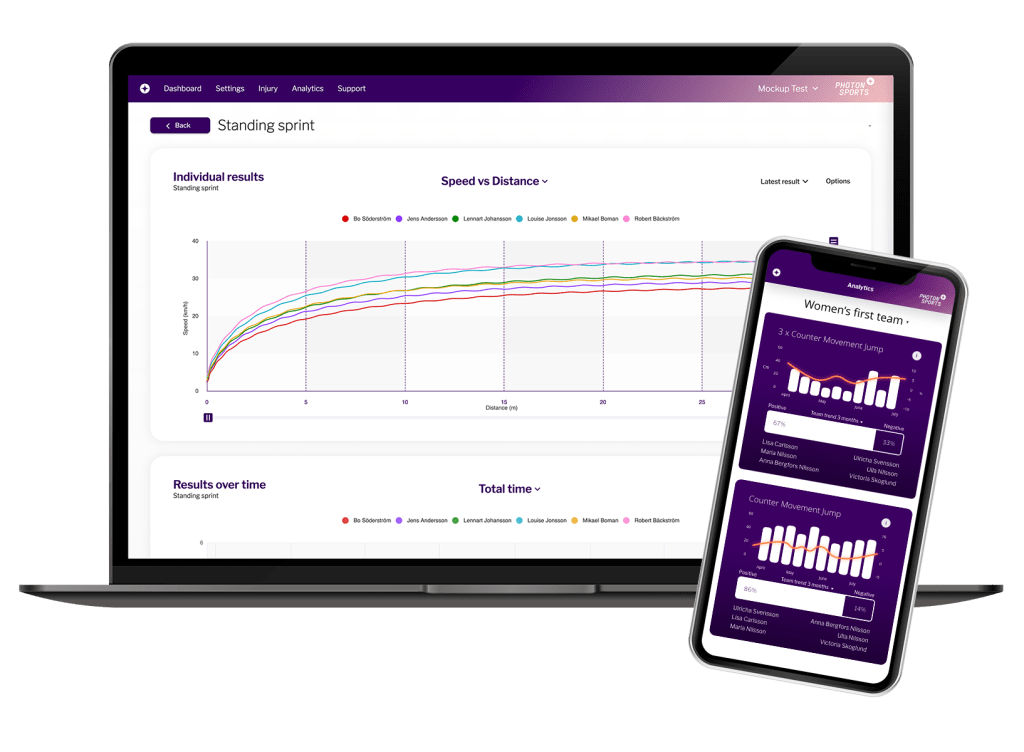
Our new Auto-Generated 30-meter sprint FVP graphs offer instant insights into your players’ strength and speed capabilities as well as force- and velocity deficits, enabling the design of personalized training programs.
Force Velocity Profile versus Total Time
Elevate your game with our Force-Velocity-Time graph. This auto-generated chart plots an athlete’s force against velocity and power over time, revealing performance potential. Identify peaks and trends for precise intervention, optimizing every effort for improved performance.
Force Velocity Profile Against Max Power
Our Force-Power-Velocity graph is your strategic ally for explosive strength. It maps force and peak power output across velocities, guiding you to efficiency. This targeted training approach boosts power and optimizes velocity for excellence.
New Possibilities for Horizontal Force-Velocity-Profiling

Force Velocity Sprint, 30 m
Just like a regular 30 meter standing sprint but our system will serve you auto-generated FVP graphs and KPIs to identify strengths and deficiencies.
KPI Examples:
- Force-velocity profile (Ns/kgm)
- Max force (N/kg)
- V0 (m/s)
- Speed at max power (m/s)

Bram Swinnen FVP Sled Pull, 10-15 m
A resisted sprint-test developed in close collaboration with Bram Swinnen to access athlete’s horizontal force- and velocity production.
KPI Examples:
- Max Force (N/kg)
- Max speed (km/h)
- Total Time (s)
- Split Time 2.5, 5, 7.5 m (s)
Request a Demo
Advance to the next level of performance. Request a demo by filling out the form.
Photon Sports might use your contact information to contact you about our products and services. You may unsubscribe at any time.